What is visual storytelling? Visual storytelling is a method of conveying narratives and ideas through visual media that empowers readers to take action. Visual storytelling options include graphics, illustrations, photography, animation, and video. Businesses that incorporate visual storytelling into their marketing can improve engagement and recall.
As a marketer ourselves, we know how difficult it can be to build a martech stack with only the best of the best design and content creation tools. After all, it’s so important to create personalized experiences for customers today. With so many different tools and options available on the market today, how do you know if you are choosing the best one for your needs and budget?
One area of content that isn’t going anywhere anytime soon is visual storytelling. In fact, marketing is becoming even more about innovation and leveraging the right tools to help marketers do their jobs better, boost marketing ROI, and reach their audiences. With more businesses utilizing content marketing, the need to imbue your content with attention-grabbing (and keeping) graphics is crucial to the success of your marketing campaigns.
Marketers are drawn to data, in large part for the potential it has to tell a good story. One of the hottest trends over the last several years is for marketers to curate data, generally from sources such as prospect, customer or industry surveys, and then use that data to tell a story. Infographics are one of the preferred tools for visual storytelling.
But how do you create an infographic?
We get it. Creating an infographic might seem overwhelming; they require time, research, and data and design resources. We’ve developed a process to ensure that designing them is as efficient and requires the least number of resources as possible. (Also, it doesn’t hurt to follow a design checklist to ensure things are publish-ready!)
- Gather data. Surveys are often reliable methods for gathering data. They don’t require a ton of time and effort, as long as you have a large email list and can get a quick consensus from decision-makers on what questions should be in your survey.
- Organize and conceptualize the data story. Once you have the data you want to convey in your graphic, the next step is to organize it into an easily understood format that a designer can work with and follow. Remember, designers typically aren’t data analysts. Therefore, the more organization you put into the data, the easier it will be for the designer to follow, and the more accurate your infographic will be. The ideation processes to format the data into rough specifications for your designer often takes several long meetings with different decision-makers.
- Draft and revise the visualization. After you have designer-ready specifications, you’ll meet with your designer and put them to work. They’ll get a rough draft back to you. You’ll revise. They’ll redesign. You’ll revise again… and so forth until you have a design that is ready for publishing.
Producing infographics more easily with tools
Curating the data and generating ideas around the story you will tell are inescapable steps in the production of your infographic. From my experience, however, those steps account for well under half of the effort. The majority of effort is spent on getting the designer aligned with your vision and creating it.
Thankfully, there are a number of tools that help non-designers create visual storytelling aids.
In this article, we review what we consider to be the three largest players in the space: Piktochart, Canva, and Visme.
Judging process
We have no personal stake in any of these companies. In an effort to conduct my analysis fairly, and in a non-biased fashion, we will be judging each tool on the same criteria:
- Time to get going. How hard is it to get started with the tool? Do they have training, tool tips, or videos to help you learn what you’re doing?
- Overall ease-of-use. How well designed is the user interface? Is it intuitive? How easy is it to use?
- Rich features. How does the actual infographic-building functionality stack up? What features are available? How do they help usability?
- Availability and depth of template choices. How many templates are available? Are there templates that could be easily used as a starting design?
- Price. How much does it cost?
- Fun factor. Is the solution fun to use?
At the end of the article, you can see the grading rubric with the specific criteria weighting that we used to measure each solution. We also assigned an “overall winner” to one of these three solutions.
So, how exactly did we go about judging these solutions? First, we spent approximately 30 minutes using each tool. Even though we have used each of these tools in the past, these tools have made recent upgrades, improvements, and added functionality.
As a result, we have adjusted my ratings and comparisons based on my findings.

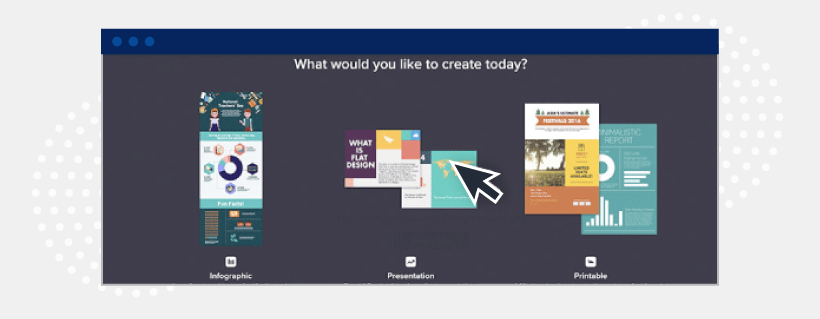
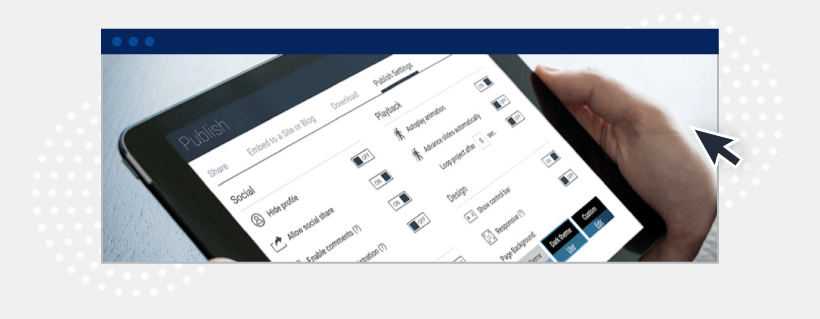
Piktochart in-depth review
Launched in 2011, Piktochart is the most well known of the three tools. Even though the team is based in a distant time zone in Malaysia, Piktochart was the most responsive of the three solutions when we reached our.
Jacqueline Jensen, Piktochart’s community evangelist, shared this about their company vision: “Our team of 60 is working each day to democratize design and give non-designers tools to make their information beautiful. Nearly 8 million individuals, companies, nonprofits, and educators use Piktochart to create, and this year our focus is set on continued innovation.”
 After using Piktochart for 30 minutes
We really like Piktochart. It is designed with an easy-to-use interface, and the chart builder is fabulous. There are multiple presentation templates available, but only a few are available with the free version. You have to upgrade to a paid subscription to access the full range of available templates. There are also fewer templates available in the free version than Canva or Visme.
Additionally, Piktochart is not designed with as many robust features, functionalities, and options when compared with Canva or Visme.
One key difference from my first experience and tool comparison is that the templates in Piktochart are now better organized and categorized, similar to Canva, making them easier to sort through.
Piktochart pros
- Piktochart’s map and chart builders still reign above all three tools. You easily start creating your infographic from scratch or select a template from the gallery. Then, you can easily begin editing, formatting, and adding content as you see fit. For example, it is super easy to add text, graphics and visuals, logos, and so on. The toolbox sits conveniently to the left of your infographic, allowing you to move, add, and remove blocks as needed without the toolbar being in the way.
- The “Download as blocks” feature is also on the top of my “awesome” list. Since the majority of infographics we create involve breaking them into smaller parts, the “download as blocks” feature is super helpful. With Piktochart, you can use the “download as blocks” feature to have ready-to-tweet, smaller micro-graphics, without having to save each one individually.
- Piktochart also offers a “share” feature directly in the chat builder tool, which generates a preview link that you can copy and paste into an email or Slack message.
- Piktochart offers a wealth of free graphics to use within your creations. It also allows you to easily upload your own images and photos.
- Available tutorials. Piktochart offers a number of free tutorials available, blogs, how-to guides, resources, and other tools that can help users with little to no design experience.
- Users can now search the Piktochart infographics in their workspace by searching for file name or title. This was previously a “con” on our list.
Piktochart cons
- No rich media (HTML5) export options.
- You can only have up to five infographics in your workspace with the free version.
- There are a number of more content upgrade options available but are only available with a paid subscription.
 Pricing for Piktochart
$24/user/month if paid annually
My grade for Piktochart
A- (3.70 out of 5 possible points)
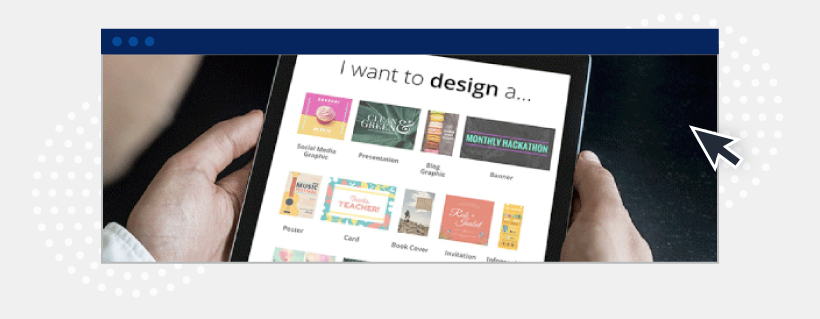
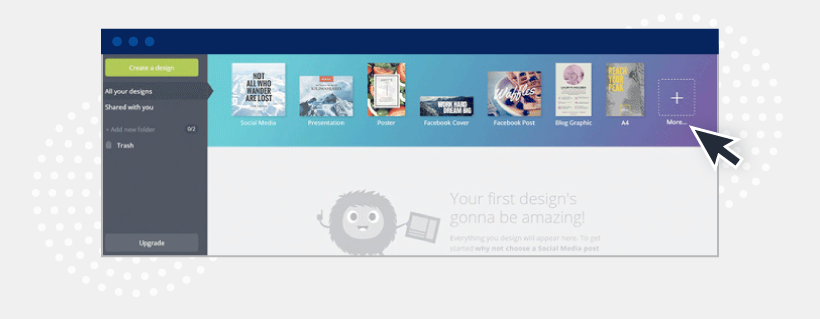
Canva in-depth review
Founded shortly after Piktochart (2012), Canva has received a lot of positive press and several large rounds of funding. Canva is based out of Sydney, Australia. Despite repeated outreach for a quote, they never got back to us. It didn’t leave a good first impression. If there is an option to contact sales, it should be serviced (without having to go through social channels).
After using Canva for 30 minutes
Canva is a great tool when it comes to simplicity and ease-of-use. While it definitely wins the “ease-of-use” category with flying colors, it isn’t as robust as Piktochart. Canva used to take the lead in social media and design layouts and graphics, but their infographic selection was quite limited. However, over time, Canva has added to their infographic template library, which bumps it up on the list of favorites.
 Canva pros
- Canva offers an awesome “learn” section on their website to help newbies and advanced designers navigate the tool. There are also a number of videos available for users to reference while designing their infographics for if or when they are in a pinch.
- Canva offers a slew of different visual assets you can create: social media images, full-sheet graphics, cards, presentations, posters, infographics, and more. Canva offers the widest range of design items and content available for free out of the three tools.
- Over the years, Canva has certainly jumped into many marketers’ tech stacks, and for good reason. Canva is an easy-to-use, cost-effective, and vast design hub for marketers, content creators, and social media marketers. There are a number of excellent sticker-looking graphical call-outs that resonate well with the artistically astute crowd.
- Canva now organizes their infographics by category, including education, process, timeline, charity, and more. This point was previously on the “cons” list, so it’s great to see that Canva has made some improvements in this area.
Canva cons
- No rich media (HTML5) export options. You also cannot import data from other applications, which is one of the things we loved about Piktochart.
- Didn’t respond to requests for a quote. They are well-funded and seem to get a lot of attention in the media, which is great. However, sometimes when companies aren’t as hungry for growth, they aren’t responsive to customer input. This may be the case with Canva.
- Canva isn’t exactly the best option in terms of usability, and comes with a small learning curve. In fact, if you aren’t a designer, or even if you are using the tool for the first time, it can take up to 15 minutes to get acquainted with it.
Pricing for Canva
$9.95/user/month if paid annually
My grade for Canva
B+ (3.55 out of 5 possible points)
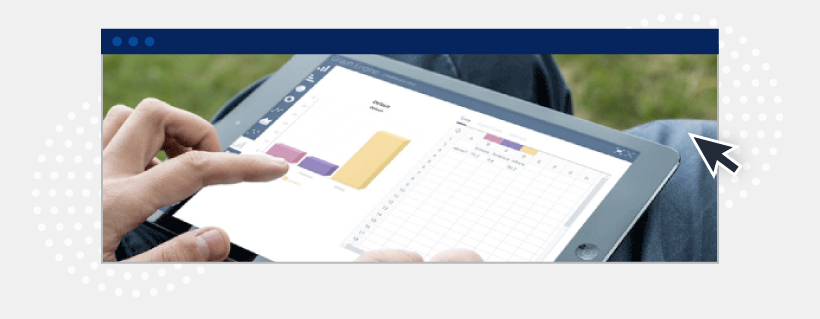
Visme in-depth review
Visme also launched in 2012, shortly after Canva. Like Piktochart, they were quick to respond to my request for a quote, and their founder/CEO actually responded. They are based in the United States.
Payman Taei, the founder and president of Visme, said this about his company: “Visme was created with one primary goal in mind: To allow anyone with or without design knowledge to easily translate their ideas and stories into engaging visuals, where you’re only limited by your imagination. Visme has spent years transforming itself into one easy-to-use app that inspires users to create better content in form of engaging presentations, infographics, and other visual formats so you can publish and share their content online or download for offline use.”
After using Visme for 30 minutes
Over the years, Visme has come a long way in terms of a polished user-interface compared with the other two tools. Additionally, it matches the same full suite of custom graphics options as Canva, such as social media graphics, headers, infographics, cards, presentations, and more.
However, Visme offers a lot more in terms of functionality. It allows you to publish interactive and animated infographics, which distinguishes this tool from the other two platforms. It also has great charting functionality that almost rivals Piktochart. Overall, the feature set in Visme is far more robust than in Piktochart or Canva.
Visme pros
- One of my favorite features of Visme is the keyword search function for the templates. When looking for a starter template, simply type in a keyword for the type of layout you are looking for, and it returns relevant results within seconds. Not bad.
- Another feature we love is the ability to create interactive and animated infographics in Visme. Although this feature is available in Canva, Visme is a lot better. You can make long-format infographics that change as you scroll. To do that, you need to export/publish them as HTML5 infographics — a function that is only possible in Visme.
- As we mentioned above, the three tools enable you to create designs in addition to infographics. While Canva wins in this category, Visme has some great options for banner advertisements. Their banner ad and social banner/post templates are better than the other two.
- Another great function that makes Visme stand alone is its foldering (yes, it’s a word) capability. As your design library grows, you can keep all your assets organized with their foldering system.
- Visme’s chart-building tool has also come a long way. Although we love Piktochart’s chart-builder, we were pretty impressed to see the user-interface advancements with theirs. Visme now offers clean, clear, and intuitive content blocks to easily create an infographic from scratch with little to no design experience.
Visme cons
- Visme is so robust that it takes a little longer to learn. It’s obvious Visme doesn’t have as much experience with creating slick user interfaces, making the time to learn the solution a little longer. Although there is a help function available, it will still require significant exploration to learn how the tool works.
- Changing, cloning, and moving the sections in Visme isn’t as easy as it is in Piktochart, but it has made serious improvements.
- They have 18,000+ free images you can pull into your infographic, but the options for isolated photo elements on transparent backgrounds are nonexistent.
 Pricing for Visme
$25/user/month if paid annually (for the “Premium” Visme suite)
My grade for Visme
A (4.05 out of 5 possible points)
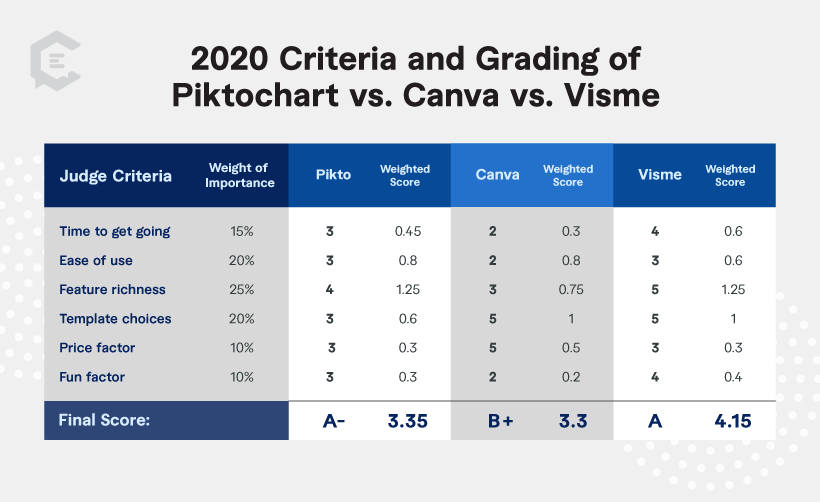
The grading criteria and rubric
Interested in seeing the math behind the grades?
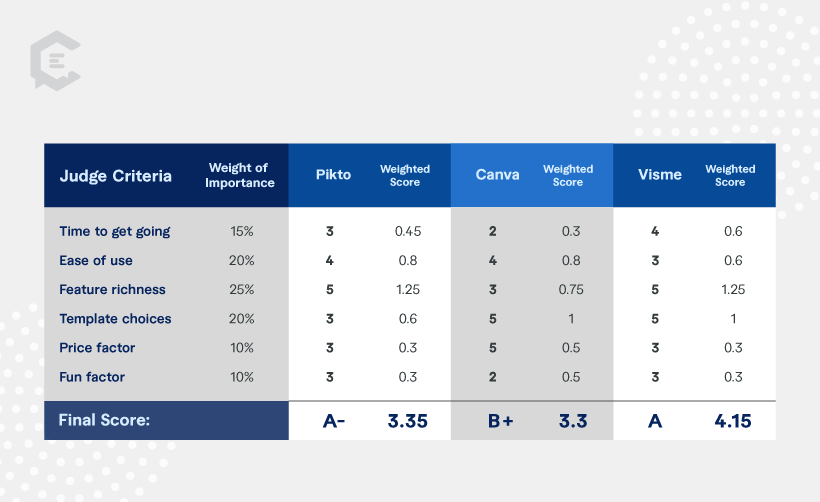
The last two year’s editions of this head-to-head review, for which you can see the grading comparison below, came in very close on scores. Last year, Visme considerably widened the gap between its offerings and those from Piktochart and Canva, but in my latest review, Canva decreased the gap some, with Piktochart and Visme remaining about on par.
We graded them as we tested each one, and put down each grade independently of one another. Although each tool is awesome and has its own unique features, even when performing this analysis a third time around, Visme is still the winner. Its extra functionality still outweighs that of both Piktochart and Canva — and getting the best infographics for visual storytelling requires high levels of feature richness.
2020: Piktochart vs. Canva vs. Visme – Grading by martech expert Ben Beck
2018: Piktochart vs. Canva vs. Visme – Grading by martech expert Ben Beck
Visualize your next steps
Hopefully this review helps. But tools are just that – tools. You need to have sound creators and strategies in place to leverage those tools effectively and ensure the quality of your content. Lucky for you, we already have a vast network of teams and creators in place that you can outsource to and get immediate results. Talk to a strategist today to see how we can take your content creation to the next level.