A good marketer knows that content marketing is imperative to the success of their overall marketing efforts, but convincing a company’s leadership of that importance can be difficult. Company leaders may fret over the lack of insight into how content marketing is really helping drive the bottom line (revenue) for their company.
That’s why the use of data is more crucial than ever for marketers to prove the value of their content marketing efforts’ true effectiveness and impact on revenue generation. But where to start?
Analytics systems, such as Google Analytics, are so easy to set up that there are few reasons for a company not to do so. However, with so much data available in the analytics suites it can be discombobulating to know where to start. Creating a kickin’ analytics dashboard enables a marketer to look impressive, keep their marketing KPIs top of mind, and better prove out the true effectiveness of their content marketing efforts. And with the abundance of dashboarding tools available to marketers, creating a well-built content marketing dashboard is easier than ever.
In this article, we’ll cover why analytics dashboards are important, what options you have for your analytics visualizations, a comparison of Google Analytics vs. Databox, and then show you how you can build your own content marketing Google Analytics dashboard in less than 30 minutes.

Why an analytics dashboard is important
Whether it be Adobe Analytics, Google Analytics, or some other Analytics platform, if you’ve spent much time inside one of these tools you’ve seen that they offer a lot of valuable information, but in a disaggregated fashion. To get the information you’re looking for, you may need to click into one of twenty different reports. Once you do find what you’re looking for, it can be difficult to visualize the relationship of that metric to another one you saw three reports earlier.
Unifying these most important data points into one content marketing dashboard is important to saving time, better finding relationships between different marketing KPIs, and providing a visually stunning representation of your hard work — all in one spot.
Several content marketing KPI-related questions your analytics dashboard will help you answer include:
- What is the general health of your blog?
- How well is your content performing on the various social media networks?
- Which SEO benefits are being realized with your content distribution?
- Which content is performing the best at generating long and deep web visits?
- Who are your website visitors and what content resonates with those specific demographics?
- How much revenue are you influencing/generating?
What options do you have for analytics dashboard build-outs
They come in many names (business intelligence, data analytics, analytics dashboards, etc.) but these tools generally do the same thing: They enable you to better visualize the data you are capturing on your web visitors.
If you work at a large enterprise, with tens of different software systems capturing data on your site visitors and customers, you may want to look at a more robust business intelligence tool like Tableau or Domo. For the rest (most of you), though, you’ll find the best success visualizing your content marketing metrics inside of Google Analytics directly, or with a simple data overlay app such as Databox, Grow or Cyfe.
I’ve tried most of the turnkey marketing KPI visualization tools out there, and prefer Databox (for simplicity and elegance). As such, in this guide, I’ll show you how you can build a Google Analytics dashboard directly inside Google, and/or in Databox, in less than 30 minutes.

Google Analytics vs. Databox
For most use cases, a dashboard inside Google Analytics may suffice. They come free with your already free Google Analytics services and are relatively flexible. There are some situations, though, where you may need another layer in your analytics marketing technology stack to assist in visualization.
Databox will be a helpful addition to you if:
- You have data from multiple websites you’d like to visualize together in one place.
- You have metrics from different platforms (such as Google Analytics, Twitter and SEMRush) that you’d like all in one spot.
- You have more advanced needs, such as being able to easily display your dashboard on a TV screen in your workspace.
There are usually ways you can do the above mentioned, more advanced analytics-related needs inside of Google Analytics. For example, even though Google doesn’t offer a good way of displaying a dashboard on a TV screen in your office (where it is always updating and always there when you turn on your TV’s media player after a weekend of being turned off), you can use automations, scripts, and browser hacks to make it work. It isn’t bulletproof, though, and can lead to headaches troubleshooting your duct-taped together solution when things go awry.
This is why, for businesses that have a little more sophisticated dashboarding needs, I recommend a third party app like Databox.
How to build a Google Analytics dashboard to optimize content marketing strategies
Both Google and Databox have pre-built dashboards you can simply clone to get started. While that may sound super easy, you’ll have a slight learning curve learning how to navigate the process, get the right dashboard, and customize it. As such, I’ll walk you through each of these steps for Google Analytics, showing you how you can get your own content marketing dashboard started in under 30 minutes!
Databox’s import process is very similar, but I’ll still briefly show you how you can get started with dashboards in Databox at the end of this article.
How to use a Google Analytics pre-built dashboard:
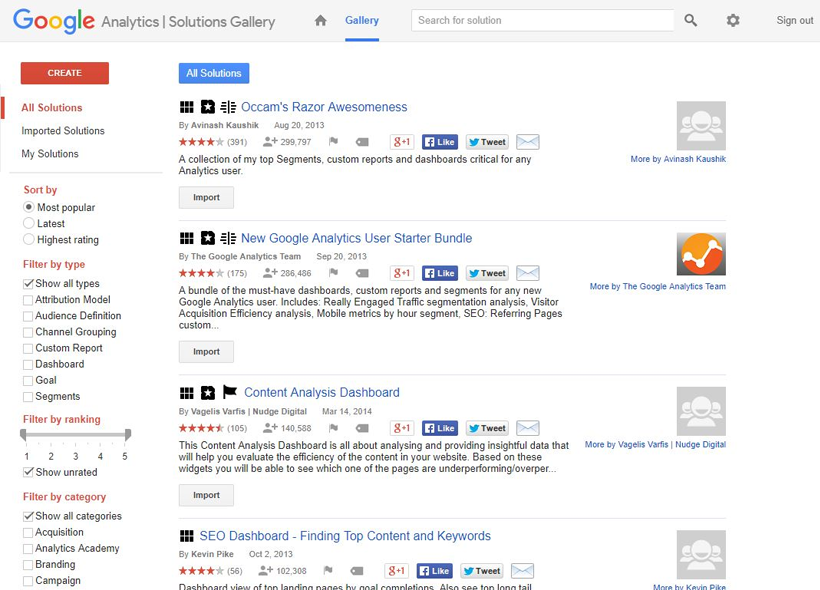
I’ve used several analytics platforms and business intelligence visualization tools, including Adobe and Domo, but Google Analytics’ Solution Gallery still stands out as the best. It has over 10,000 user-submitted templates that you can import to your account with a simple click of the “Import” button.
1. Choose your template.
To set up a content marketing KPI dashboard via Google Analytics’ Solutions Gallery, first, complete a search and find a template you’d like. One downside of the Solutions Gallery is that it doesn’t include a screenshot of what the dashboard looks like*, so you instead need to make your decision of whether to try it out by looking through the rating, comments of other users, and the paragraph description that explains what the dashboard includes.
* One thing to note is with custom dashboards in Google Analytics: If you import something you don’t like, it is easy to remove the dashboard and start over. So don’t feel locked into any of the templates you’re trying out.
2. Import the template.
When you’re on the solution page for the pre-built dashboard you’d like to use, simply click on the import button. The solution template I’m using in this example is the “Content Marketing Metrics – DH” one that is found when you search for Content Marketing-related dashboards. It’s a good one that will get you mostly to where you want to be with your own dashboard.

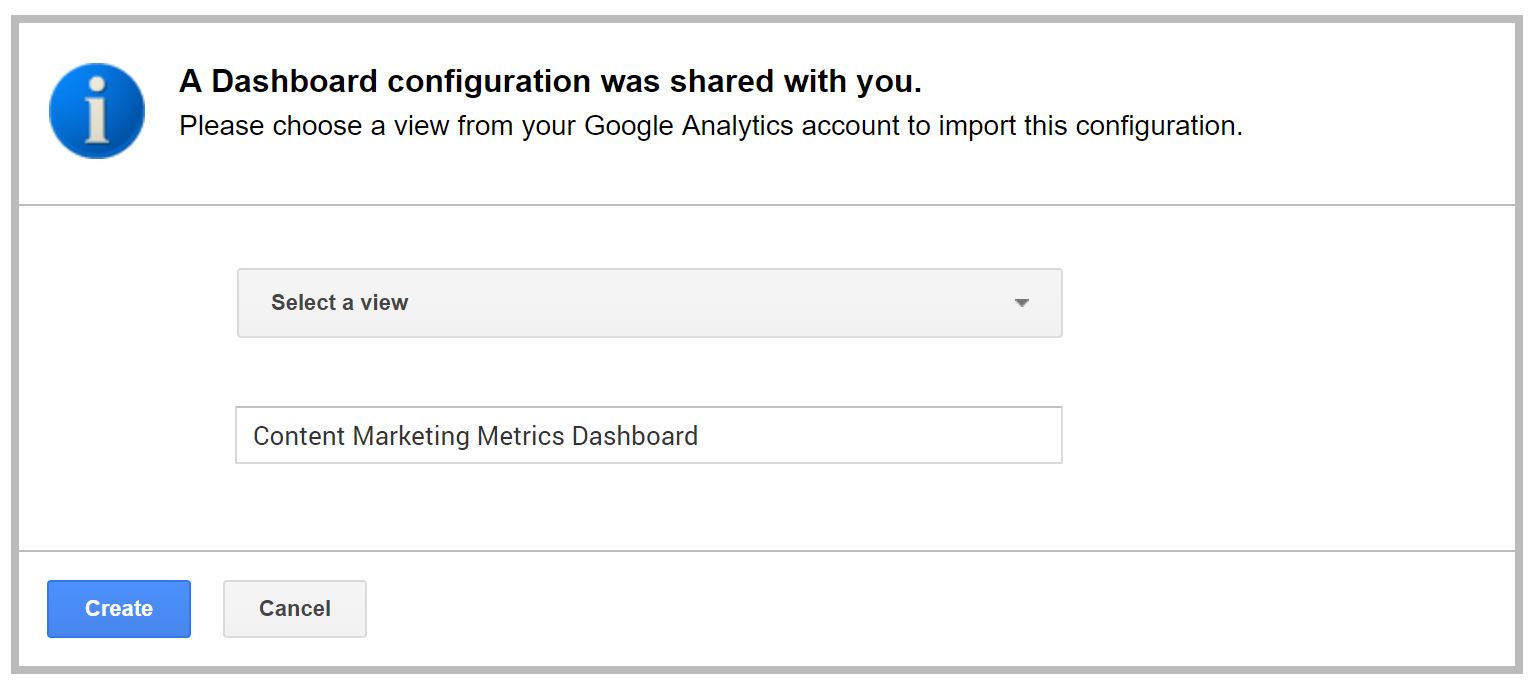
3. Choose your Google Analytics account.
Assuming you’ve already signed into your Google Analytics account in another tab, upon clicking the import button you’ll be taken to a page where you select which of your Google Analytics profiles you’d like to install the dashboard in. You can also rename the dashboard in this step.
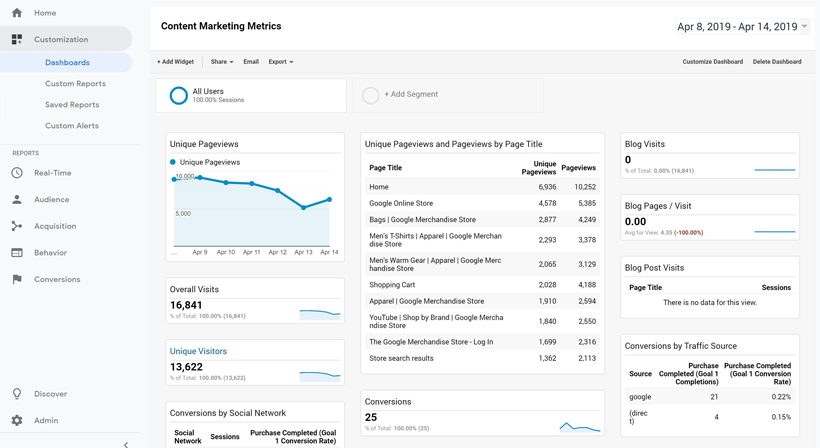
4. Evaluate your new dashboard.
Once the import step is complete (done in seconds!), you can take a look at your shiny new dashboard. Because of how Google Analytics operates, the dashboard will go to all the right reports and pull in the underlying data automagically. Without any further data import steps your dashboard is already showing you data in the different widgets — assuming you have data in your account. When looking through your dashboard you need to evaluate whether it is showing you the content marketing KPIs you were hoping for. If not, you can easily change the dashboard, as we’ll show you in the next step.
5. Customize your dashboard
Once you’ve identified ways you want to alter the pre-built dashboard template, to make it better aligned with your content marketing strategies, you’ve got five ways you can alter the dashboard:

- Customize Dashboard – “Customize Dashboard” allows to easily change the layout or the number of columns on the dashboard. Because it auto-rearranges the widgets, you may need to click and drag them to put them in the spaces you want, after changing the column count.
- Add Widget – Clicking this button allows you to select from the wide array of different widget types available to you (tables, pie charts, bar charts, geo maps, counters, etc).
- Email – From the dashboard emailer, you can select who you want to send the dashboard to; the frequency (once, daily, weekly, monthly, or quarterly); how long you want the report to go out for; and type in a message to accompany the report. The dashboard is sent as a PDF, including images of each of the widgets in your dashboard.
- Export – “Export” allows you to quickly export the dashboard as a PDF. I encourage you, before setting up an email report, to run this quick export option to see what the PDF version of your dashboard looks like.
- Re-arrange – While not in the menu area of the dashboard, if you hover over any of the widget titles you’ll see that your cursor changes into a movement icon, indicating that you can simply click and drag the widget to a new location on your dashboard.
How to use a Databox pre-built dashboard:
While Databox doesn’t have a similar, enormously sized template library like Google Analytics, it does have some great themes to get you started. Additionally, what Databox gives you is built by their company so you can be assured it is high quality. Here’s how you get started with Databox:
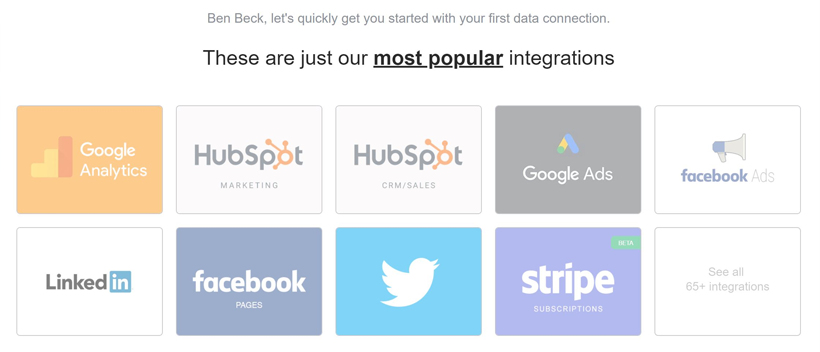
1. Choose your data connection.
Unlike Google Analytics, with Databox you can easily pull in data from multiple platforms (over 65+ data partners) to view in the same content marketing dashboard. After signing up for your account you’ll be able to select your integration by simply clicking on what you’d like to pull in data from.
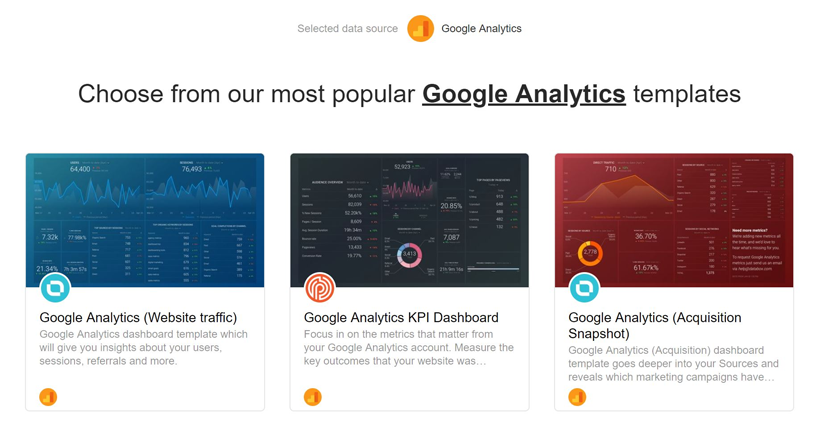
2. Choose your template.
After selecting Google Analytics as the data source, you’ll be taken to a step where you can select your template. It shows only a few templates to keep things simple, but rest assured. If you don’t end up liking one of these suggestions, they do have over 250 other templates you can select from after the onboarding process.
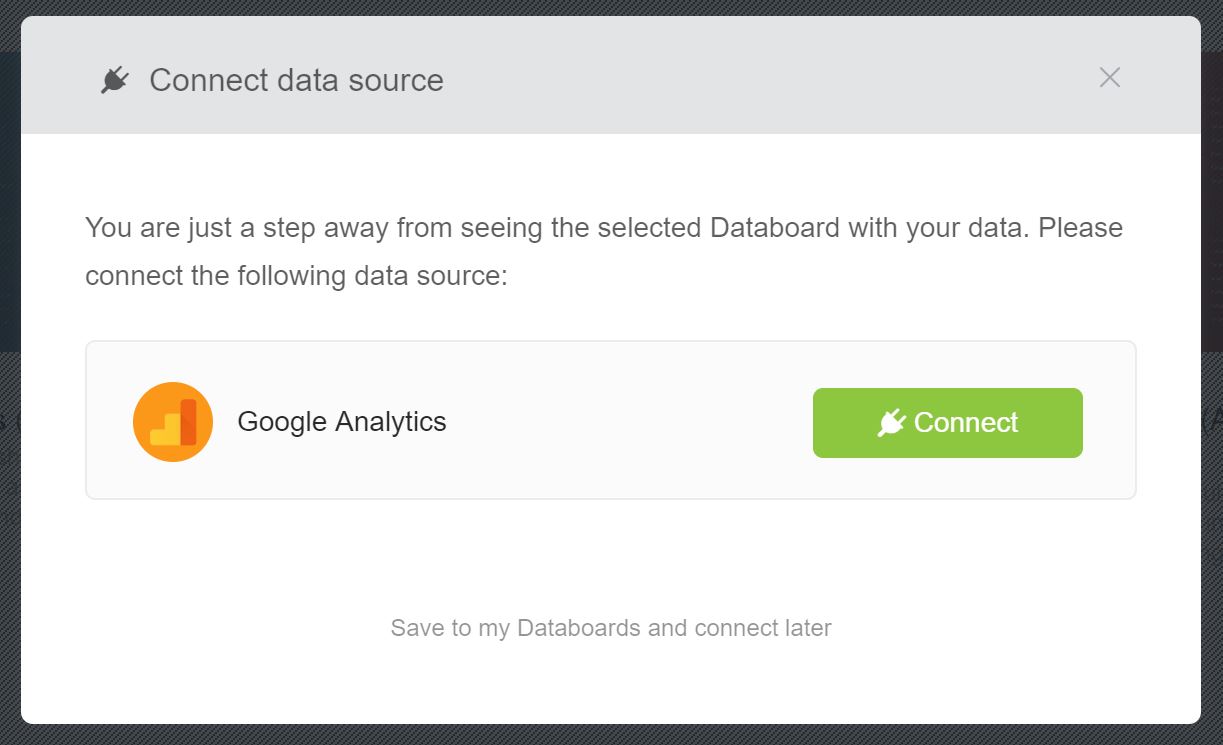
3. Connect to your Google Analytics account.
After selecting the template you’d like to use, you’ll see a popup that asks you to connect to your Google Analytics account. Simply clicking the “Connect” button will take you into the simple process where you’ll give Databox permission to access your Google Analytics data.
4. Customize your dashboard.
One area where Databox excels, in relation to Google Analytics hosted dashboards, is in the ability to customize them exactly as you’d like. Because Databox simply pulls in the raw data, you can customize your dashboards extensively, with such options as:
- Comparing multiple datasets side by side
- Altering colors and brands in the theme
- Setting the widget to display cumulative results
- Showing changes over time, etc.
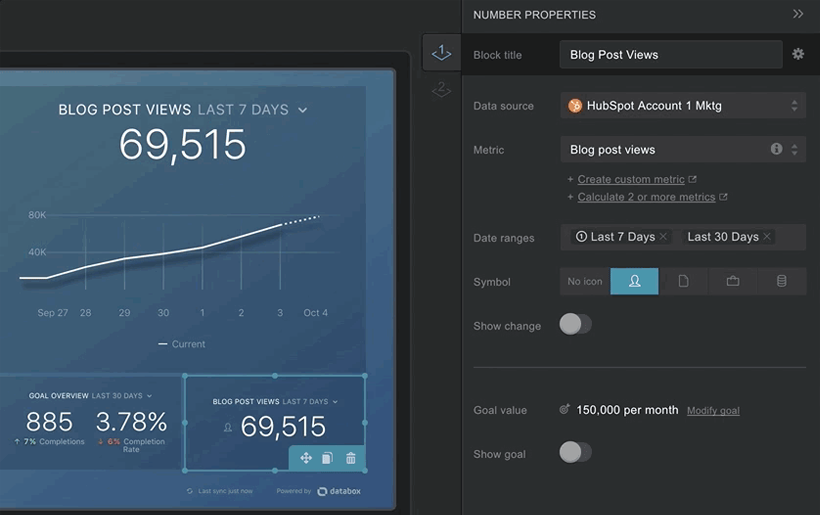
When you’re in your dashboard editor, selecting the editor option at the right of the screen will show you a panel where you can easily make your edits.
Conclusion
Whether you choose to do so with Google Analytics native dashboards, more beautiful ones in Databox, or with some other data visualization vendor, you’ll find that your management team will be impressed by your savvy and your team will find that they’re more easily able to track and hit their goals.