All the best stories have a hook that pulls you in and all great content starts with a great lead.
Good leads capture the essence of the who, what, when, where, why, and how — but without giving away the entire show. The best leads are enticing. The beckon, promising the reader their time will be well-spent and sets the tone and direction of the piece.
What is Lead Writing?
Old-school reporting ace and author of ‘The Word: An Associated Press Guide to Good News Writing,’ Jack Cappon, rightly called lead writing “the agony of square one.” A lot is hinging on your lead. From it, readers will decide whether or not they’ll continue investing time and energy into your content or jump ship. And with our culture’s currently short attention spans and patience, if your content doesn’t hook people up front, they’ll bolt. The “back” button is just a thumbtap away.
So, let’s break down the types of leads, which ones you should be writing, and the top 10 do’s and don’ts. We’ll get you hooking customers in no time.

Two Types of Leads
There are two main types of leads and many, many variations thereof. They are:
The summary lead
Most often found in straight news reports, this is the trusty inverted pyramid lead we learned about in Journalism 101. It sums up the situation succinctly, giving the reader the most important facts first. In this type of lead, you want to determine which aspect of the story — who, what, when, where, why, and how — is most important to the reader and present those facts.
An alleged virgin gave birth to a son in a barn just outside of Bethlehem last night. Claiming a celestial body guided them to the site, magi attending the birth say the boy will one day be king. Herod has not commented.
A creative or descriptive lead
This can be an anecdote, an observation, a quirky fact, or a funny story, among other things. Better suited to feature stories and blog posts, these leads are designed to pique readers’ curiosity and draw them into the story. If you go this route, make sure to provide broader detail and context in the few sentences following your lead. A creative lead is great — just don’t make your reader hunt for what the story’s about much after it.
Mary didn’t want to pay taxes anyway.
A note about the question lead. A variation of the creative lead, the question lead is just what it sounds like: leading with a question. Most editors (myself included) don’t like this type of lead. It’s lazy writing. People are reading your content to get answers, not to be asked anything. It feels like a cop-out, like a writer couldn’t think of a compelling way to start the piece. Do you want to learn more about the recent virgin birth? Well duh, that’s why I clicked in here in the first place.
Is there no exception? Sure there is. If you can make your question lead provocative, go for it — Do you think you have it bad? This lady just gave birth in a barn — just know that this is accomplished rarely.
Which Type of Lead Should You Write?
This depends on a few factors. Ask yourself:
Who is your audience?
Tax attorneys looking for recent changes in the law don’t want to wade through your witty repartee about the IRS, just as millennials searching for craft beer recipes don’t want to read a technical discourse on the fermentation process. Tailor your words to those reading the post.
Where will this article be published?
Match the site’s tone and language. There are some things you can get away with on Vice.com that would be your demise on the Chronicle of Higher Education.

What are you writing about?
Certain topics naturally lend themselves to creativity, while others beg for a “Just the facts, ma’am” presentation. Writing about aromatherapy for a yoga blog gives you a little more leeway than writing about investment tips for a retirement blog.
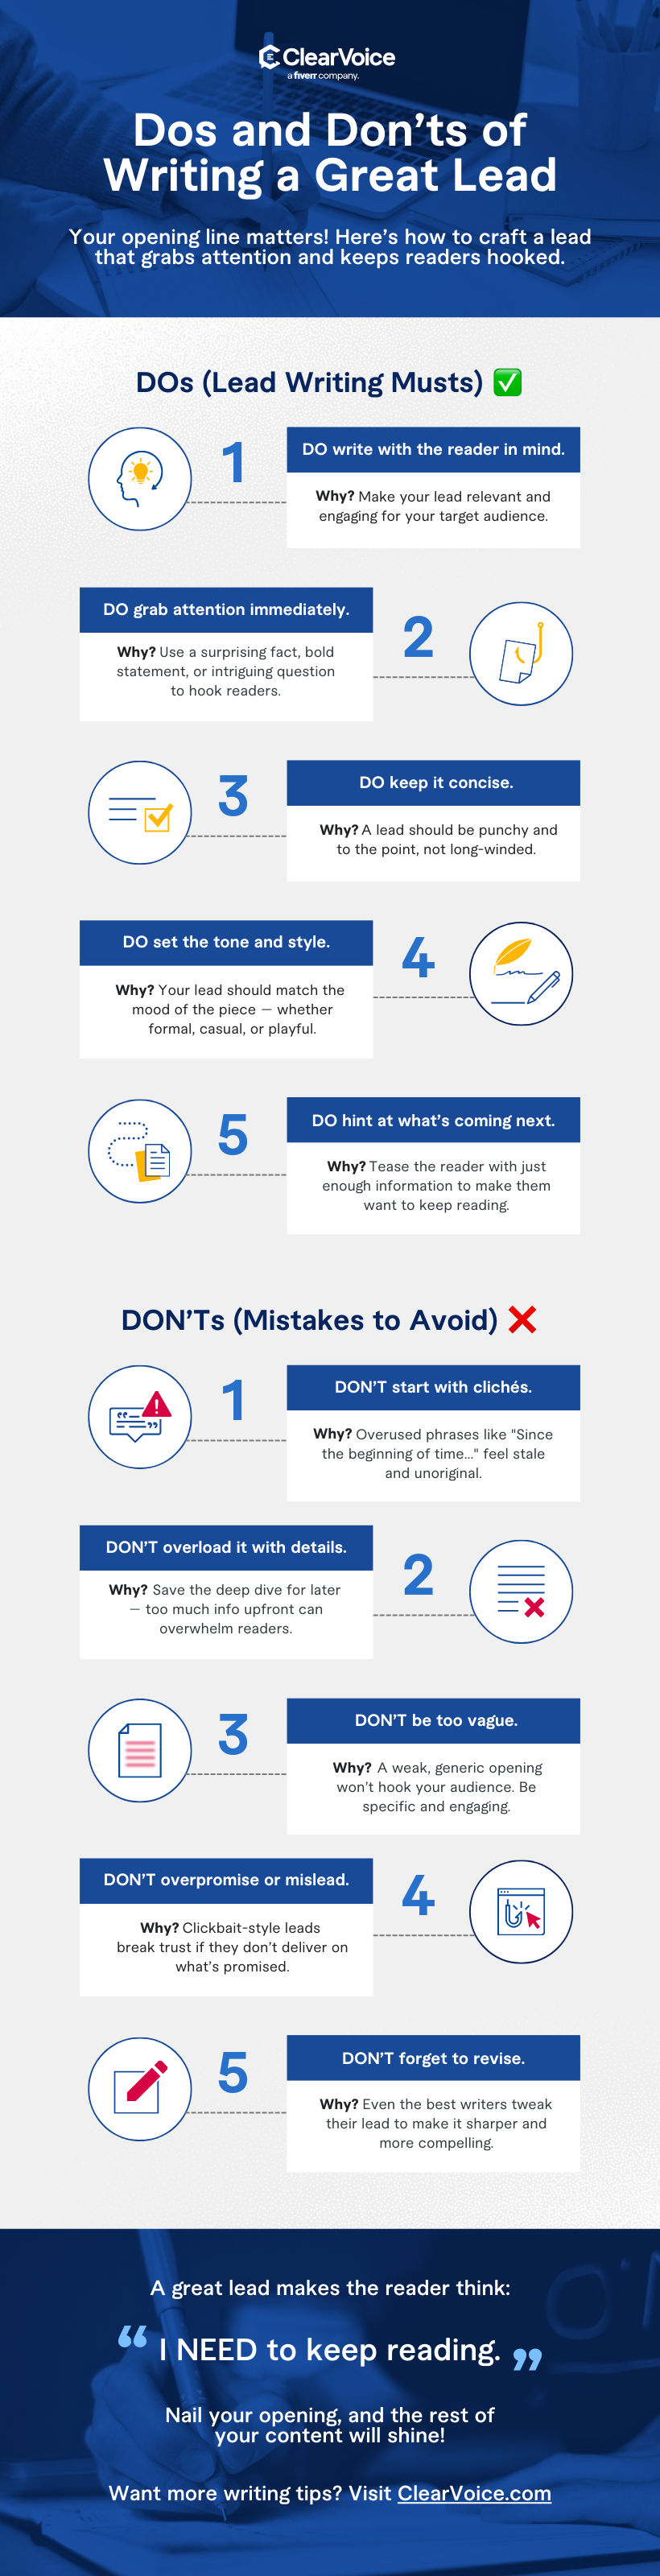
Lead Writing: Top 10 do’s
1. Determine your hook.
Look at the 5 Ws and 1 H. Why are readers clicking on this content? What problem are they trying to solve? What’s new or different? Determine which aspects are most relevant and important, and lead with that.
2. Be clear and succinct.
Simple language is best. Mark Twain said it best: “Don’t use a five-dollar word when a fifty-cent word will do.”
3. Write in the active voice.
Use strong verbs and decided language. Compare “Dog bites man” to “A man was bitten by a dog” — the passive voice is timid and bland (for the record, Stephen King feels the same way).
4. Address the reader as “you.”
This is the writer’s equivalent to breaking the fourth wall in theatre, and while some editors will disagree with me on this one, we stand by it. People know you’re writing to them. Not only is it OK to address them as such, we think it helps create a personal connection with them.
5. Put attribution second.
What’s the nugget, the little gem you’re trying to impart? Put that information first, and then follow it up with who said it. The “according to” part is almost always secondary to what he or she actually said.
6. Go short and punchy.
Take my recent lead for this Marketing Land post: “Freelance writers like working with me. Seriously, they do.” Short and sweet makes the reader want to know where you’re going with that.
7. If you’re stuck, find a relevant stat.
If you’re trying to be clever or punchy or brilliant, and it’s just not happening, search for an interesting stat related to your topic and lead with that. This is especially effective if the stat is unusual or unexpected, as in, “A whopping 80 percent of Americans are in debt.”
8. Or, start with a story.
If beginning with a stat or fact isn’t working for your lead, try leading with an anecdote instead. People absorb data, but they feel stories. Here’s an example of an anecdotal lead that works great in a crime story: “It’s just after 11 p.m., and Houston police officer Al Leonard has his gun drawn as the elderly black man approaches the patrol car. The 9mm pistol is out of sight, pointing through the car door. Leonard rolls down his window and casually greets the man. ‘What can I do for you?'” You want to know what happens next, don’t you?
9. Borrow this literary tactic.
Every good story has these three elements: a hero we relate to, a challenge (or villain) we fear, and an ensuing struggle. Find these elements in the story you’re writing and lead with one of those.
10. When you’re staring at a blank screen.
Just start. Start writing anything. Start in the middle of your story. Once you begin, you can usually find your lead buried a few paragraphs down in this “get-going” copy. Your lead is in there — you just need to cut away the other stuff first.

Lead Writing: Top 10 don’ts
1. Don’t make your readers work too hard.
Also known as “burying the lead,” this happens when you take too long to make your point. It’s fine to take a little creative license, but if readers can’t figure out relatively quickly what your article is about, they’ll bounce.
2. Don’t try to include too much.
Does your lead contain too many of the 5 Ws and H? Don’t try to jam everything in there — you’ll overwhelm the reader.
3. Don’t start sentences with “there is” or “there are” constructions.
It’s not wrong, but similar to our question lead, it’s lazy, boring writing.
4. Don’t be cliche.
5. Don’t have any errors.
Include typos or grammatical errors, and it’s game over — you’ve lost the reader.
6. Don’t say anything is “right around the corner.”
Just trust us. We’ve seen it used way too much. “Valentine’s Day is right around the corner,” “The first day of school is right around the corner,” Mother’s Day sales are right around the corner” … Zzzz. Boring.
7. Don’t make puns. Even ironically.
It’s an old example but it proves the point. From a Huffington Post story about a huge swastika found painted on the bottom of a swimming pool in Brazil: “Authorities did Nazi this coming.” Boo. Absolutely not. Don’t make the reader groan.
8. Don’t state the obvious.
Don’t tell readers what they already know. We call it “water is wet” writing. Some examples: “The internet provides an immense source of useful information.” “Today’s digital landscape is moving fast.” Really! You don’t say?
9. Don’t cite the dictionary.
“Merriam-Webster defines marketing as…” This is the close cousin of “water is wet” writing. It’s a better tactic for essay-writing middle-schoolers. Don’t do this.
10. Don’t imagine anything. You are not John Lennon.
“Imagine a world where everyone recycled,” “Imagine how good it must feel to save a life,” “Imagine receiving a $1,000 tip from your favorite customer on Christmas Eve.” Imagine we retired this hackneyed, worn-out lead.

10 Worthy Examples of Good Lead Writing
1. Short and simple.
Edna Buchanan, the Pulitzer Prize-winning crime reporter for The Miami Herald, wrote a story about an ex-con named Gary Robinson. One drunken night in the ‘80s, Robinson stumbled into a Church’s Chicken, where he was told there was no fried chicken, only nuggets. He decked the woman at the counter, and in the ensuing melee, he was shot by a security guard. Buchanan’s lead:
Gary Robinson died hungry.
2. Ooh, tell me more.
A 2010 piece in the New York Times co-authored by Sabrina Tavernise and Dan Froschjune begins:
An ailing, middle-age construction worker from Colorado, on a self-proclaimed mission to help American troops, armed himself with a dagger, a pistol, a sword, Christian texts, hashish and night-vision goggles and headed to the lawless tribal areas near the border of Afghanistan and Pakistan to personally hunt down Osama bin Laden.
3. Meanwhile, at San Quentin.
From the 1992 story titled, “After Life of Violence Harris Goes Peacefully,” written by Sam Stanton for The Sacramento Bee:
In the end, Robert Alton Harris seemed determined to go peacefully, a trait that had eluded him in the 39 violent and abusive years he spent on earth.
4. Ouch.
Remember Olympic jerk Ryan Lochte, the American swimmer who lied to Brazilian authorities about being robbed at gunpoint while in Rio for 2016 games? Sally Jenkins’ story on Lochte for The Washington Post begins:
Ryan Lochte is the dumbest bell that ever rang.
5. An oldie but man, what a goodie.
This beautiful lead is from Shirley Povich’s 1956 story in The Washington Post & Times Herald about a pitcher’s perfect game:
The million‑to‑one shot came in. Hell froze over. A month of Sundays hit the calendar. Don Larsen today pitched a no-hit, no‑run, no‑man‑reach‑first game in a World Series.
6. Dialogue lead.
Diana Marcum wrote this compelling lead for the Los Angeles Times, perfectly capturing the bleakness of the California drought in 2014:
The two fieldworkers scraped hoes over weeds that weren’t there. “Let us pretend we see many weeds,” Francisco Galvez told his friend Rafael. That way, maybe they’d get a full week’s work.
7. The staccato lead.
Ditto; we found this one in an online journalism quiz, but can’t track the source. It reads like the first scene of a movie script:
Midnight on the bridge… a scream… a shot… a splash… a second shot… a third shot. This morning, police recovered the bodies of Mr. and Mrs. R. E. Murphy, estranged couple, from the Snake River. A bullet wound was found in the temple of each.
8. Hey, that’s us.
Sure, we’ll include our own former Dear Megan column railing against exclamation points:
This week’s question comes to us from one of my kids, who will remain nameless because neither wants to appear in a dorky grammar blog written by their uncool (but incredibly good-looking) mom. I will oblige this request for anonymity because, despite my repeated claims about how lucky they are to have me, apparently I ruin their lives on a semi-regular basis. Why add to their torment by naming them here? I have so many other ways I’d rather torment them.
9. The punch lead.
From numerous next-day reports following the Kennedy assassination:
The president is dead.
10. Near perfection.
Finally, this lead comes from a 1968 New York Times piece written by Mark Hawthorne. It was recently featured in the writer’s obituary:
A 17-year-old boy chased his pet squirrel up a tree in Washington Square Park yesterday afternoon, touching off a series of incidents in which 22 persons were arrested and eight persons, including five policemen, were injured.
Time to Put That Lead Writing to Good Use
Alright, now that you’ve read this article, you’re going to be hooking readers left and right with captivating leads. What’s next? Well, if you want to showcase your new skills while working with top brands, join our Talent Network. We’ll match you with companies that fit your talent and expertise to take your career to the next level.