Data analysis involves more than just numbers and spreadsheets. Without a compelling story, the facts may not stick.
That’s where data storytelling comes in. By blending the traditional elements of storytelling with data visualizations, you can turn plain statistics into relatable and compelling narratives that captivate your audience and drive meaningful action.
In this article, we’ll explore each aspect of data storytelling and give you some practical examples to follow.
Data Storytelling Elements Mirror Traditional Storytelling
Like any good story, a data story has a setting, characters, a situation, and a resolution. This makes complex data easier to understand, helping communicate insights more effectively. Plus, it makes your data insights more memorable and persuasive.
Let’s break down each aspect.
“The stars of stickiness are the students who made their case telling stories.”
-Chip and Dan Heath, NYT Bestselling Authors
Setting the Scenes with Data
A compelling data story begins with a clear setting that lays out the problem or opportunity at hand. Always provide your audience with the context they need to understand and appreciate the insights you’re about to share.
If the goal is to improve content engagement, begin with data showcasing historical engagement metrics, audience behavior patterns, and why you’re not capturing the audience’s attention.
“For 71% of business leaders and data professionals, data storytelling is very important when reporting results to the C-suite or other key stakeholders.”
-Exasol
Visual Techniques and Tools to Set the Scene
- Techniques: Charts and graphics, infographics, dashboards, maps, and timelines
- Tools: Tableau, Power BI, Google Data Studio, Qlik Sense, Canva
Characters: The Heart of Your Story
Characters make your data story relatable. They bridge the gap between numerical data and real-world experiences, allowing your audience to connect both emotionally and intellectually with your narrative.
“By 2025, data stories will be the most widespread way of consuming analytics.”
-Gartner
Your story’s characters can be:
- A customer embodying the collective experiences of a key audience segment.
- An employee whose insights highlight internal processes or challenges.
- A product or service plays a central role in fulfilling a customer’s need.
- A competitor to frame your story around challenges and opportunities.
Incorporating any of these characters will make your insights more tangible and relatable.
Crafting the Situation
The plot is where the data begins to tell the story, revealing trends or conflicts that are key to understanding the situation and moving the narrative forward.
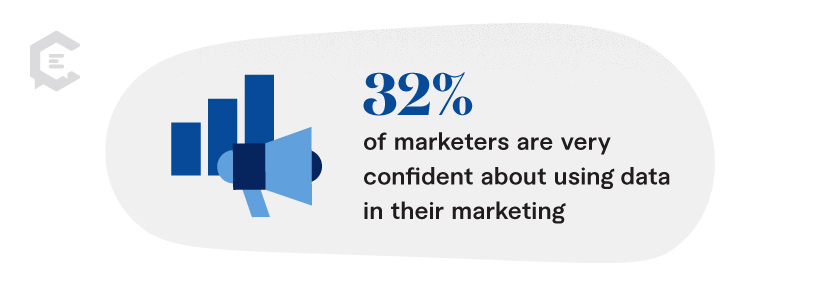
“Only 32% of marketers are very confident about using data in their marketing.”
-Venngage
Examples of Trends and Conflicts:
- Trend: Sales figures and customer testimonials showcasing the growing popularity of a new product line.
- Trend: Website analytics data illustrating a shift in how customers are interacting with your products or content.
- Conflict: Certain segments are underperforming despite overall growth.
- Conflict: Declining sales despite high customer satisfaction scores.
Finding the Resolution
As the story concludes, the data’s implications are finally clear and you can propose data-driven solutions to address the core challenges the story highlights.
Because the audience can now fully understand the story behind the data, they are equipped to react to the present and envision the future. It’s time to impart clear insights and actionable recommendations.
“Stories are 22x more memorable than facts.”
-Jerome Bruner, Cognitive Psychologist
Resolution Examples:
- Outline clear actions to leverage strengths and address weaknesses
- Provide data-backed recommendations, such as adjusting product offerings.
- Suggest how best practices can be applied more broadly.
- Identify potential future trends to help customers visualize what’s next.
- Present ways to proactively mitigate risks and seize opportunities.
Turn Numbers into Compelling Narratives
Data storytelling is an art – and its power lies in its ability to turn cold, hard numbers into stories that inform, engage, and incite action.
Are you ready to turn data storytelling into a brand differentiator? Connect with ClearVoice to discuss how.


